ebpf 技术与系统观测

什么是系统观测
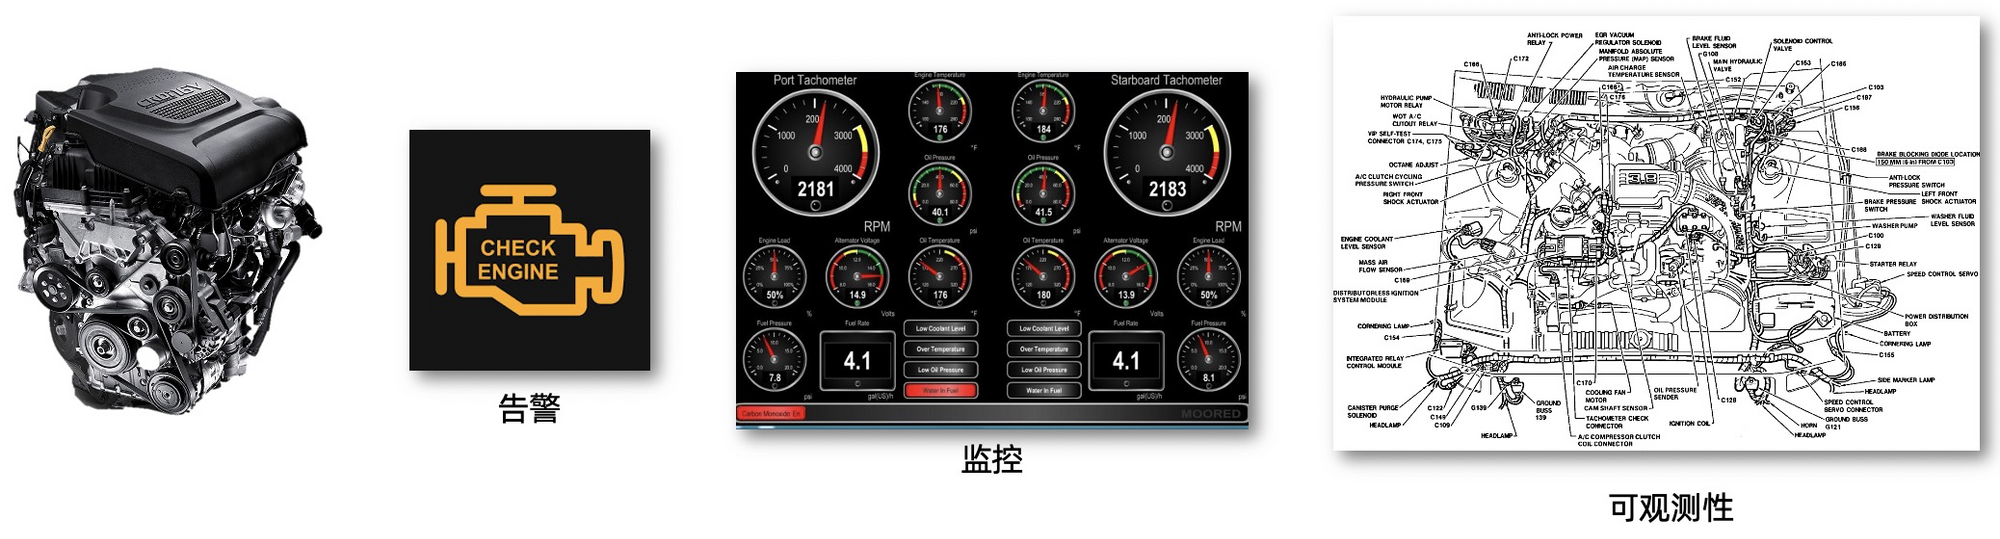
系统可观测性
如下两段代码 A 和 B 所示,可以思考一个问题:这两段代码是否都需要具备可观测性:
- 代码片段 A
#include <stdio>

int main() {
    printf("hello world\n");
}
- 代码片段 B
package main

import (
	"flag"
	"fmt"
	"os"
	"path/filepath"

	"k8s.io/apimachinery/pkg/api/errors"
	metav1 "k8s.io/apimachinery/pkg/apis/meta/v1"
	"k8s.io/client-go/kubernetes"
	"k8s.io/client-go/tools/clientcmd"
)

func main() {
	var kubeconfig *string
	if home := homeDir(); home != "" {
		kubeconfig = flag.String("kubeconfig", filepath.Join(home, ".kube", "config"), "(optional) absolute path to the kubeconfig file")
	} else {
		kubeconfig = flag.String("kubeconfig", "", "absolute path to the kubeconfig file")
	}
	deploymentName := flag.String("deployment", "", "deployment name")
	imageName := flag.String("image", "", "new image name")
	appName := flag.String("app", "app", "application name")

	flag.Parse()
	if *deploymentName == "" {
		fmt.Println("You must specify the deployment name.")
		os.Exit(0)
	}
	if *imageName == "" {
		fmt.Println("You must specify the new image name.")
		os.Exit(0)
	}
	// use the current context in kubeconfig
	config, err := clientcmd.BuildConfigFromFlags("", *kubeconfig)
	if err != nil {
		panic(err.Error())
	}

	// create the clientset
	clientset, err := kubernetes.NewForConfig(config)
	if err != nil {
		panic(err.Error())
	}
	deployment, err := clientset.AppsV1beta1().Deployments("default").Get(*deploymentName, metav1.GetOptions{})
	if err != nil {
		panic(err.Error())
	}
	if errors.IsNotFound(err) {
		fmt.Printf("Deployment not found\n")
	} else if statusError, isStatus := err.(*errors.StatusError); isStatus {
		fmt.Printf("Error getting deployment%v\n", statusError.ErrStatus.Message)
	} else if err != nil {
		panic(err.Error())
	} else {
		fmt.Printf("Found deployment\n")
		name := deployment.GetName()
		fmt.Println("name ->", name)
		containers := &deployment.Spec.Template.Spec.Containers
		found := false
		for i := range *containers {
			c := *containers
			if c[i].Name == *appName {
				found = true
				fmt.Println("Old image ->", c[i].Image)
				fmt.Println("New image ->", *imageName)
				c[i].Image = *imageName
			}
		}
		if found == false {
			fmt.Println("The application container not exist in the deployment pods.")
			os.Exit(0)
		}
		_, err := clientset.AppsV1beta1().Deployments("default").Update(deployment)
		if err != nil {
			panic(err.Error())
		}
	}
}

func homeDir() string {
	if h := os.Getenv("HOME"); h != "" {
		return h
	}
	return os.Getenv("USERPROFILE") // windows
}
很显然代码片段 B 更需要有好的观测性因为它是一个横跨多个系统的复杂调用。所以,一个系统需要具备观测性本质原因是它是一个多人协作、多系统协作的复杂系统。为了减少复杂性给系统带来的状态判断的难度,“白盒”的方式看透整个复杂系统的运行状况从而可以快速定位和解决问题,这就是系统观测性的核心奥义。
系统可观测性的工作主要有4个部分即数据源 ---> 数据 ---> 算力 ---> 算法:
- 数据源:SDK,埋点,探针;
- 数据:获取、收集数据并做数据归类分析;
- 算力:数据的存储、处理需要的计算机资源;
- 算法:系统可观测性的核心奥义是快速定位和解决已知和未知的问题,而发挥数据的价值——发现问题、解决问题(例如数值算法、AIOps等)都需要算法支持;
根据观测性工作的主要部分,可以得出一个结论,系统可观测性能够很好的落地需要具备两个特点:
- 数据覆盖足够全面
- 数据关联与统一分析
观测系统数据类型
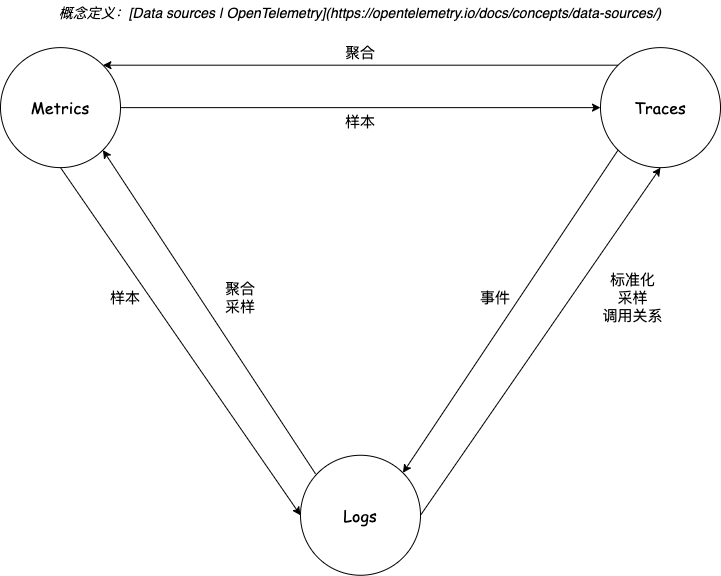
Logs、Traces、Metrics 作为可观测性数据的三剑客,基本可以满足各类监控、告警、分析、问题排查等需求,然而实际场景中,我们经常会搞混每种数据的适用形态,这里再大致罗列一下这三类数据的特点、转化方式以及适用场景:
Logs
A log is a timestamped text record, either structured (recommended) or unstructured, with metadata. While logs are an independent data source, they may also be attached to spans.
Logs 主要是按照时间戳记录事/物变化的文本载体,对于常见的访问日志、交易日志、内核日志等文本型以及包括 GPS、音视频等泛型数据也包含在其中。Logs 在调用链场景结构化后其实可以转变为 Trace,在进行聚合、降采样操作后会变成 Metrics。
Metrics
A metric is a measurement about a service, captured at runtime. Logically, the moment of capturing one of these measurements is known as a metric event which consists not only of the measurement itself, but the time that it was captured and associated metadata.
Application and request metrics are important indicators of availability and performance. Custom metrics can provide insights into how availability indicators impact user experience or the business. Collected data can be used to alert of an outage or trigger scheduling decisions to scale up a deployment automatically upon high demand.
OpenTelemetry defines three metric instruments today:
- counter: a value that is summed over time – you can think of this like an odometer on a car; it only ever goes up.
- measure: a value that is aggregated over time. This is more akin to the trip odometer on a car, it represents a value over some defined range.
- observer: captures a current set of values at a particular point in time, like a fuel gauge in a vehicle.
Metrics 是聚合/测量计算后的数值,这些数值一般是代表正在运行的服务的某项指标(例如可用性、性能等指标),相对比较离散,一般有 name、labels、time、values 组成,Metrics 数据量一般很小,相对成本更低,查询的速度比较快。
Traces
Traces track the progression of a single request, called a trace, as it is handled by services that make up an application. The request may be initiated by a user or an application. Distributed tracing is a form of tracing that traverses process, network and security boundaries.
Traces 某个过程的调用日志,除了定义了调用的父子关系外(一般通过 TraceID、SpanID、ParentSpanID 关联),一般还会定义操作的服务、方法、属性、状态、耗时等详细信息,通过 Trace 能够代替一部分 Logs 的功能,通过 Trace 的聚合也能得到每个服务、方法的 Metrics 指标。
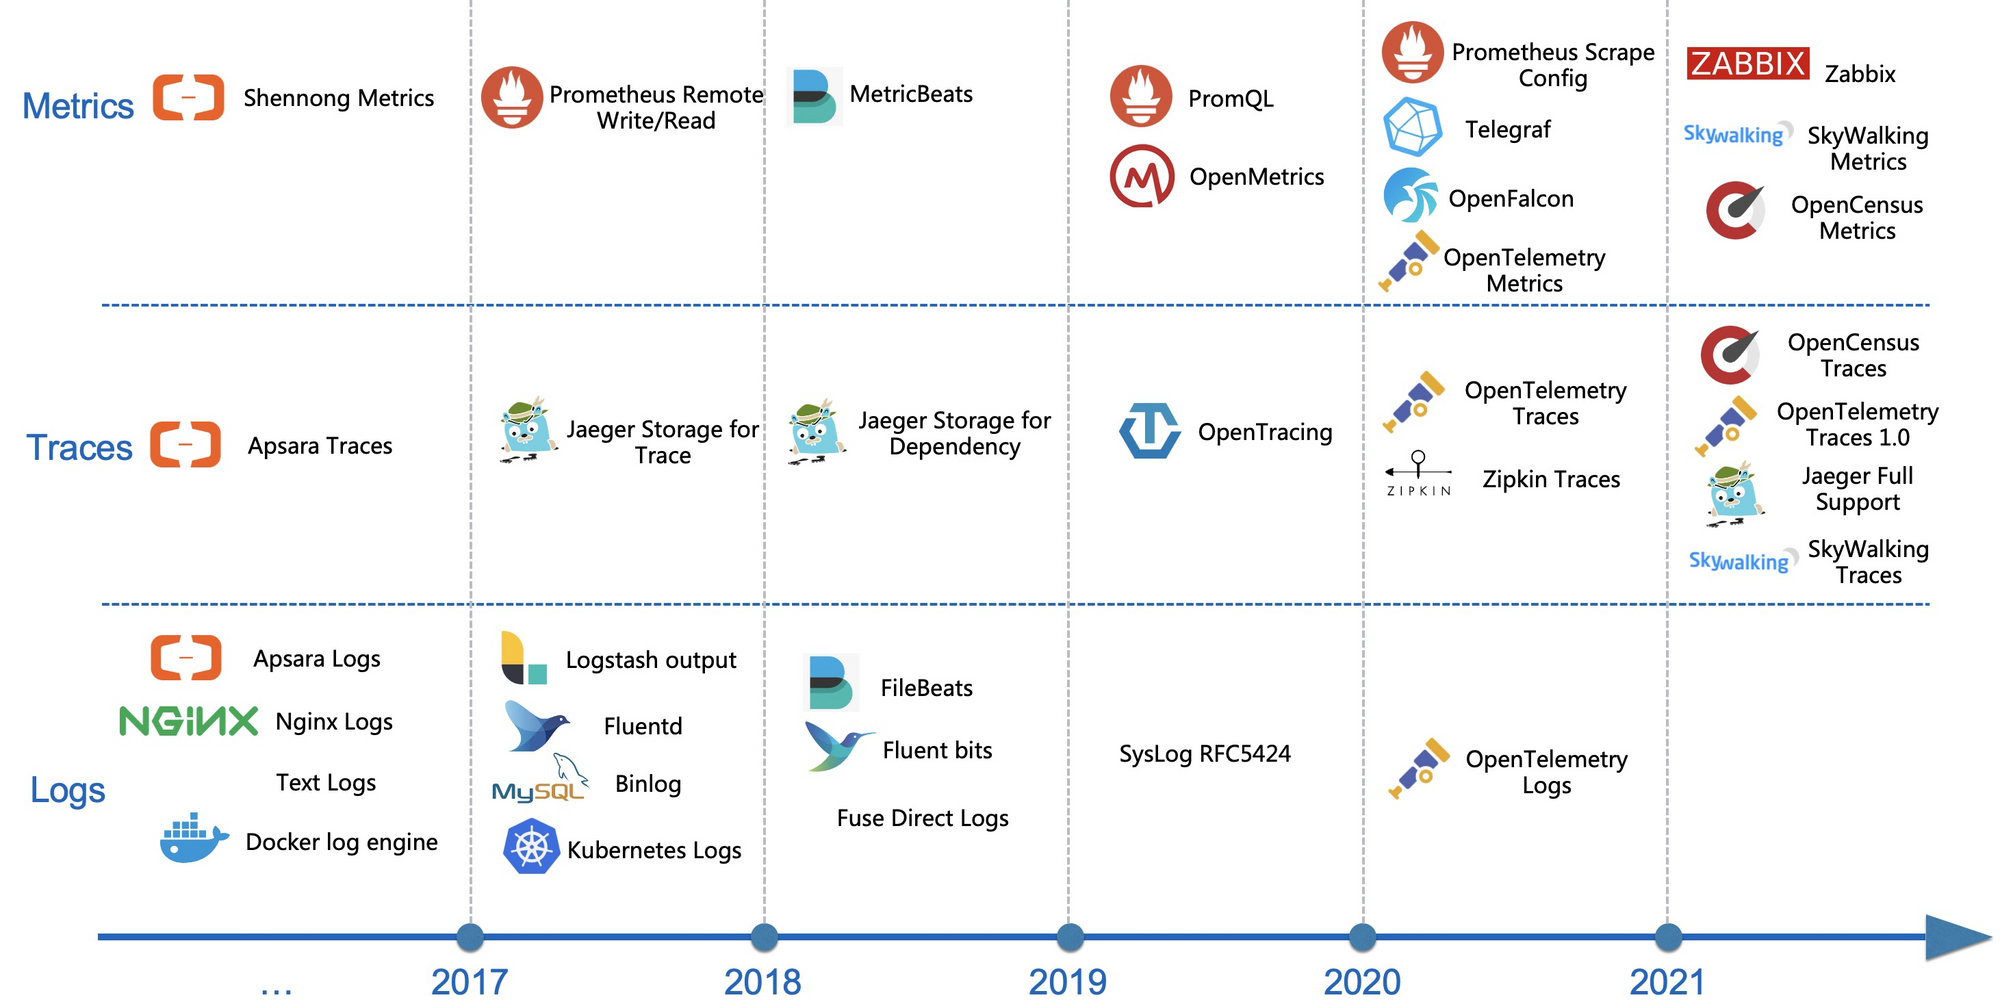
观测系统解决方案
业界也针对这种情况推出了各类可观察性相关的产品,包括开源、商业化的众多项目。例如:
- Metrics:Zabbix、Nagios、Prometheus、InfluxDB、OpenFalcon、OpenCensus
- Traces:Jaeger、Zipkin、SkyWalking、OpenTracing、OpenCensus
- Logs:ELK、Splunk、SumoLogic、Loki、Loggly
bpf 与系统观测
通过对可观测性相关知识系统性的学习和了解,可以对 bpf 做一个定性的判断即 bpf 技术适合充当数据源和数据收集的角色,可观测性系统应当需要的数据存储能力、数据处理能力、数据分析能力、数据应用能力全部缺失,而这些能力的构建完全超出了 bpf 技术的能力范围。
bpf 技术的优劣
bpf 作为可观测性,有自身的得天独厚的优势,但也有自身的劣势,我打算先看看这个问题:
- 优势
- 能够获取的数据横跨内核态、用户态,目前看来数据应该是比较全面的;
- 对于业务可以做到无损探伤;
- 对于业务性能提升有一定的优势(相对于静态埋点的方式);
- bpf 获取数据是可编程的,可以做 Log 数据源,可以做 Trace 数据源,也可以做 Metrics 数据源,十分灵活;
- 劣势
- Java、Python 这一类有运行时 vm 的语言不太好应用;
- Kernel 版本敏感,吞吐数据的能力受到内核的限制;
- 探针点敏感,探针点和目标数据解析会受到目标二进制的源码变化的影响;
- bpf 开发运维有较高的门槛,还需要配套的管控运维设施;
bpf 技术与系统观测
通过上述分析可以看出 bpf 在 observability 领域最大的优势:数据全面、无损探伤、性能较好、软件定义数据(Sofaware-Defined Data)。综合上述分析,bpf 技术支持 observability 场景背后的理念应该是:帮助观测系统更快、更好、无损地获取可编程的观测数据。
bpf 支持 observability 的需求是:
- 帮助 golang、c/c++ 等语言构建 AOP-like 的数据收集机制;(cloud native bpf + language parsing support)
- 数据收集机制需要对在线业务无损;(解耦业务逻辑)
- 数据收集机制需要对运维友好;(可配置)
- 数据收集机制需要支持数据定制或者结构化;(数据可定制)
上面就是我自己总结的关于 bpf 技术在 observability 领域产品化背后的设计哲学。
Public discussion